100% client-side • No tracking • Your data stays yours
Visualize your
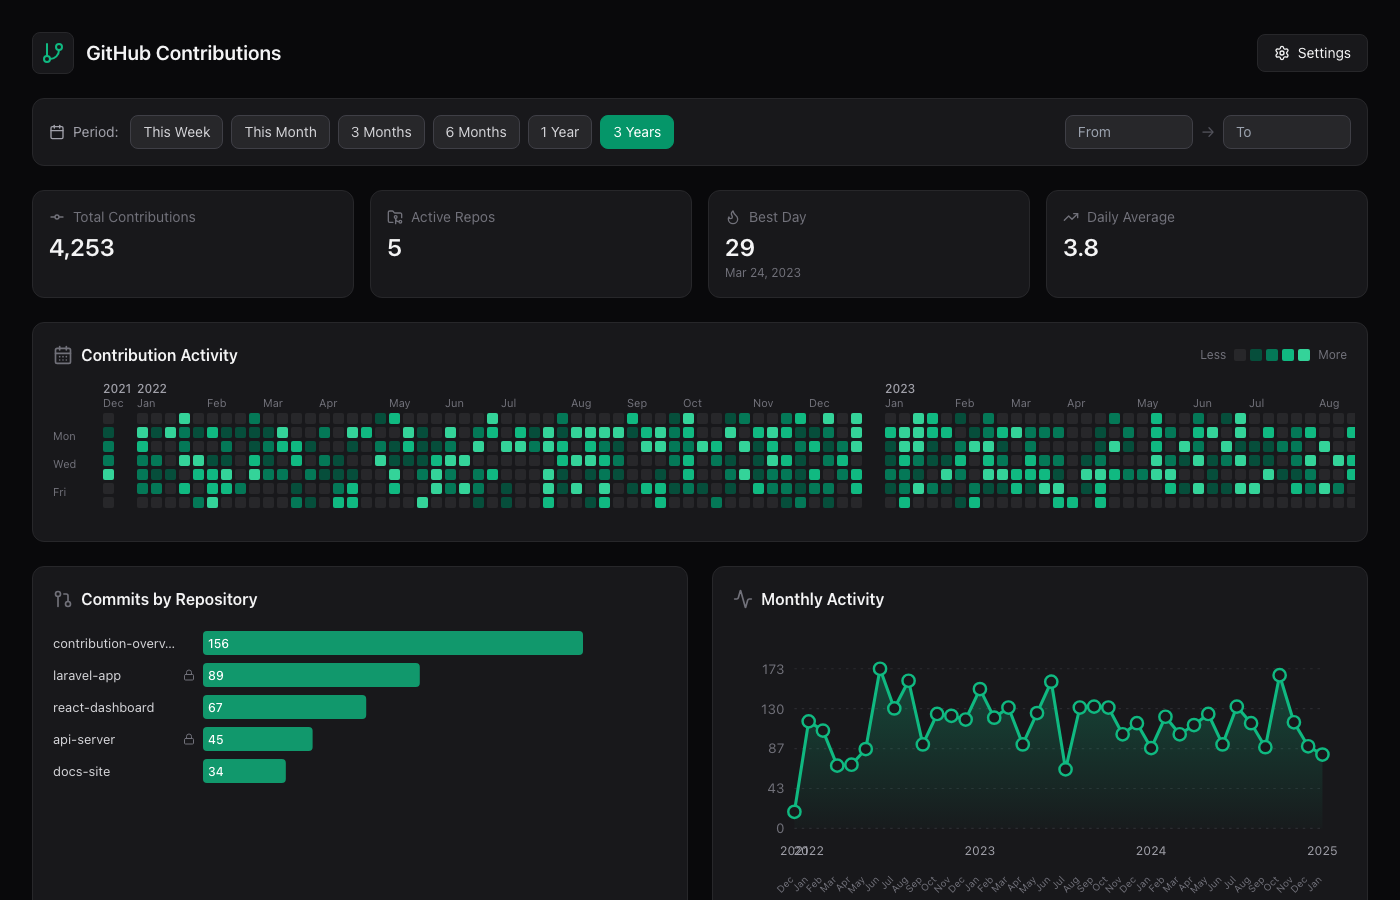
GitHub Story
A beautiful dashboard for your contribution history. Heatmaps, charts, and insights — all running locally in your browser.